KNOWLEDGE
AI made your outbound 3x faster. What defines success when 95% of your market still isn’t buying (now)?

Close article


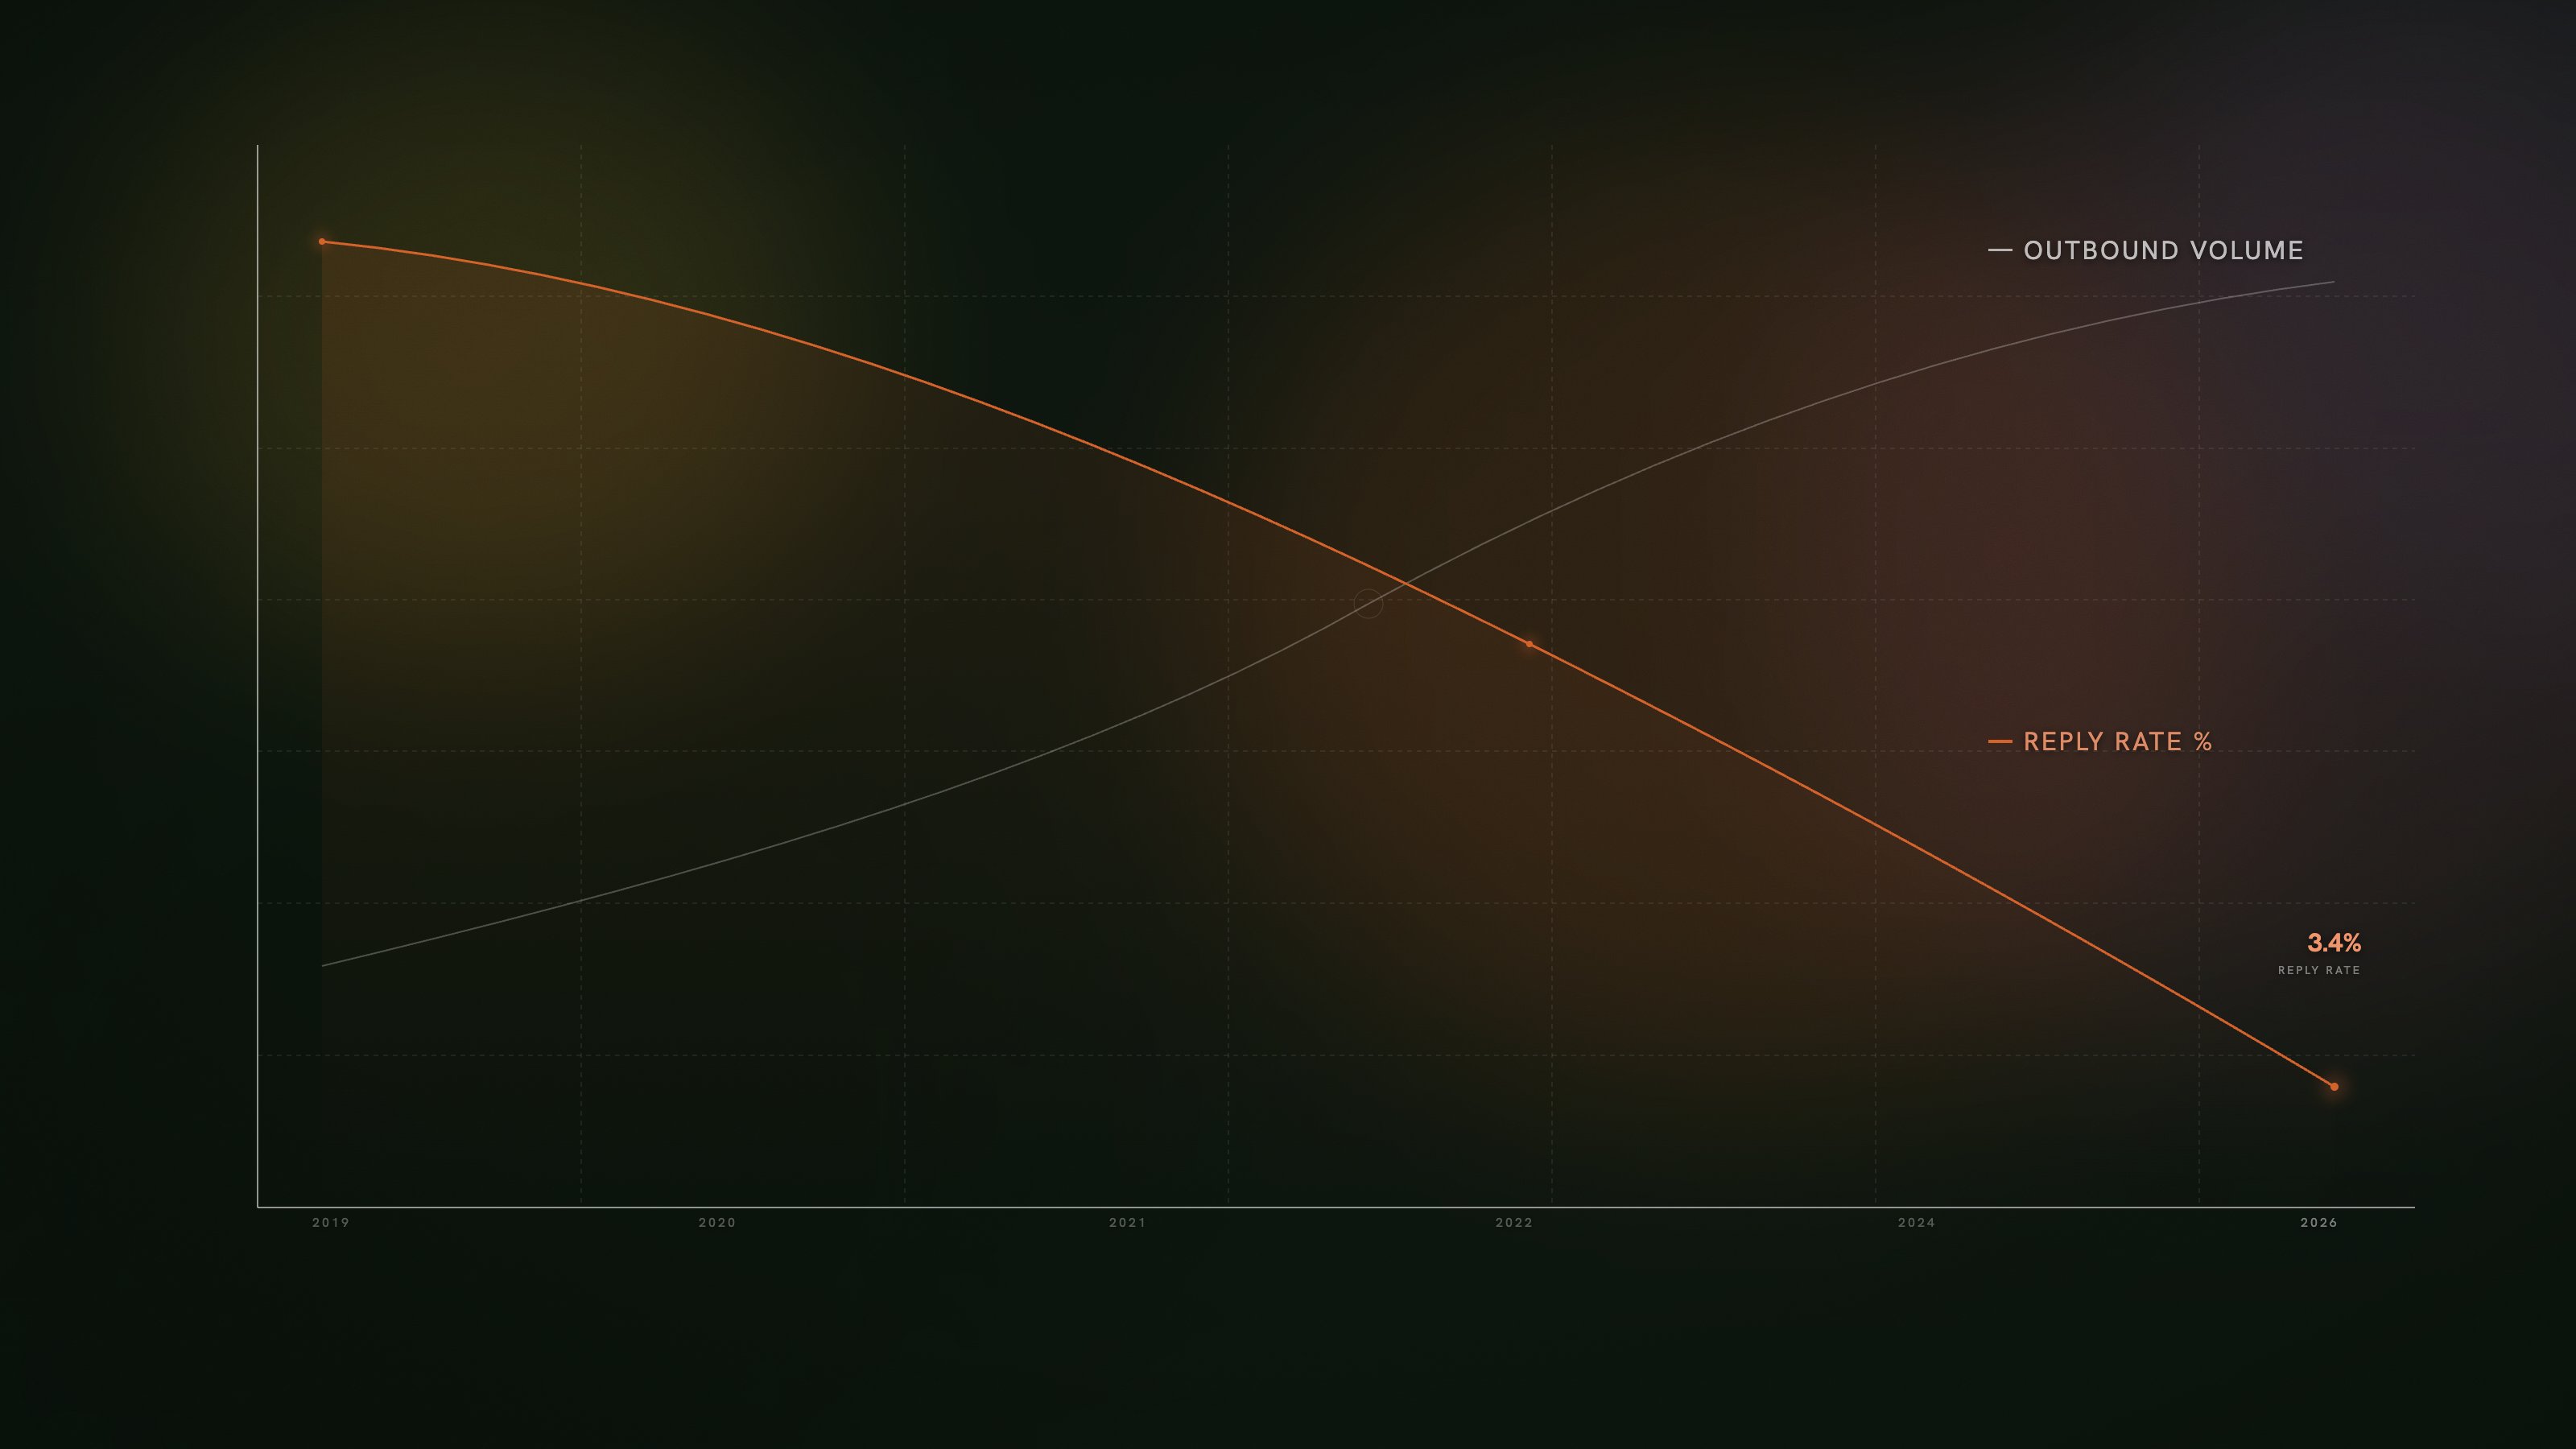
Your outbound machine is running. The tools are better than ever. AI writes your emails, enriches your data, personalizes at scale. Yet reply rates keep dropping, CAC keeps climbing, and pipeline stays flat.
The problem isn’t your tooling. The problem is that you’re reaching the wrong people at the wrong time - and AI is only making that faster. Below you’ll find the data, the framework and five concrete actions to shift from volume-based outbound to signal-based GTM.
THE PROBLEM
AI made outbound faster. But the results got worse.
The promise was clear: AI would transform outbound. One SDR doing the work of three. Hyper-personalized messages at scale. Automated enrichment, sequencing, and follow-up. And that promise has been delivered - technically.
But the results tell a different story.
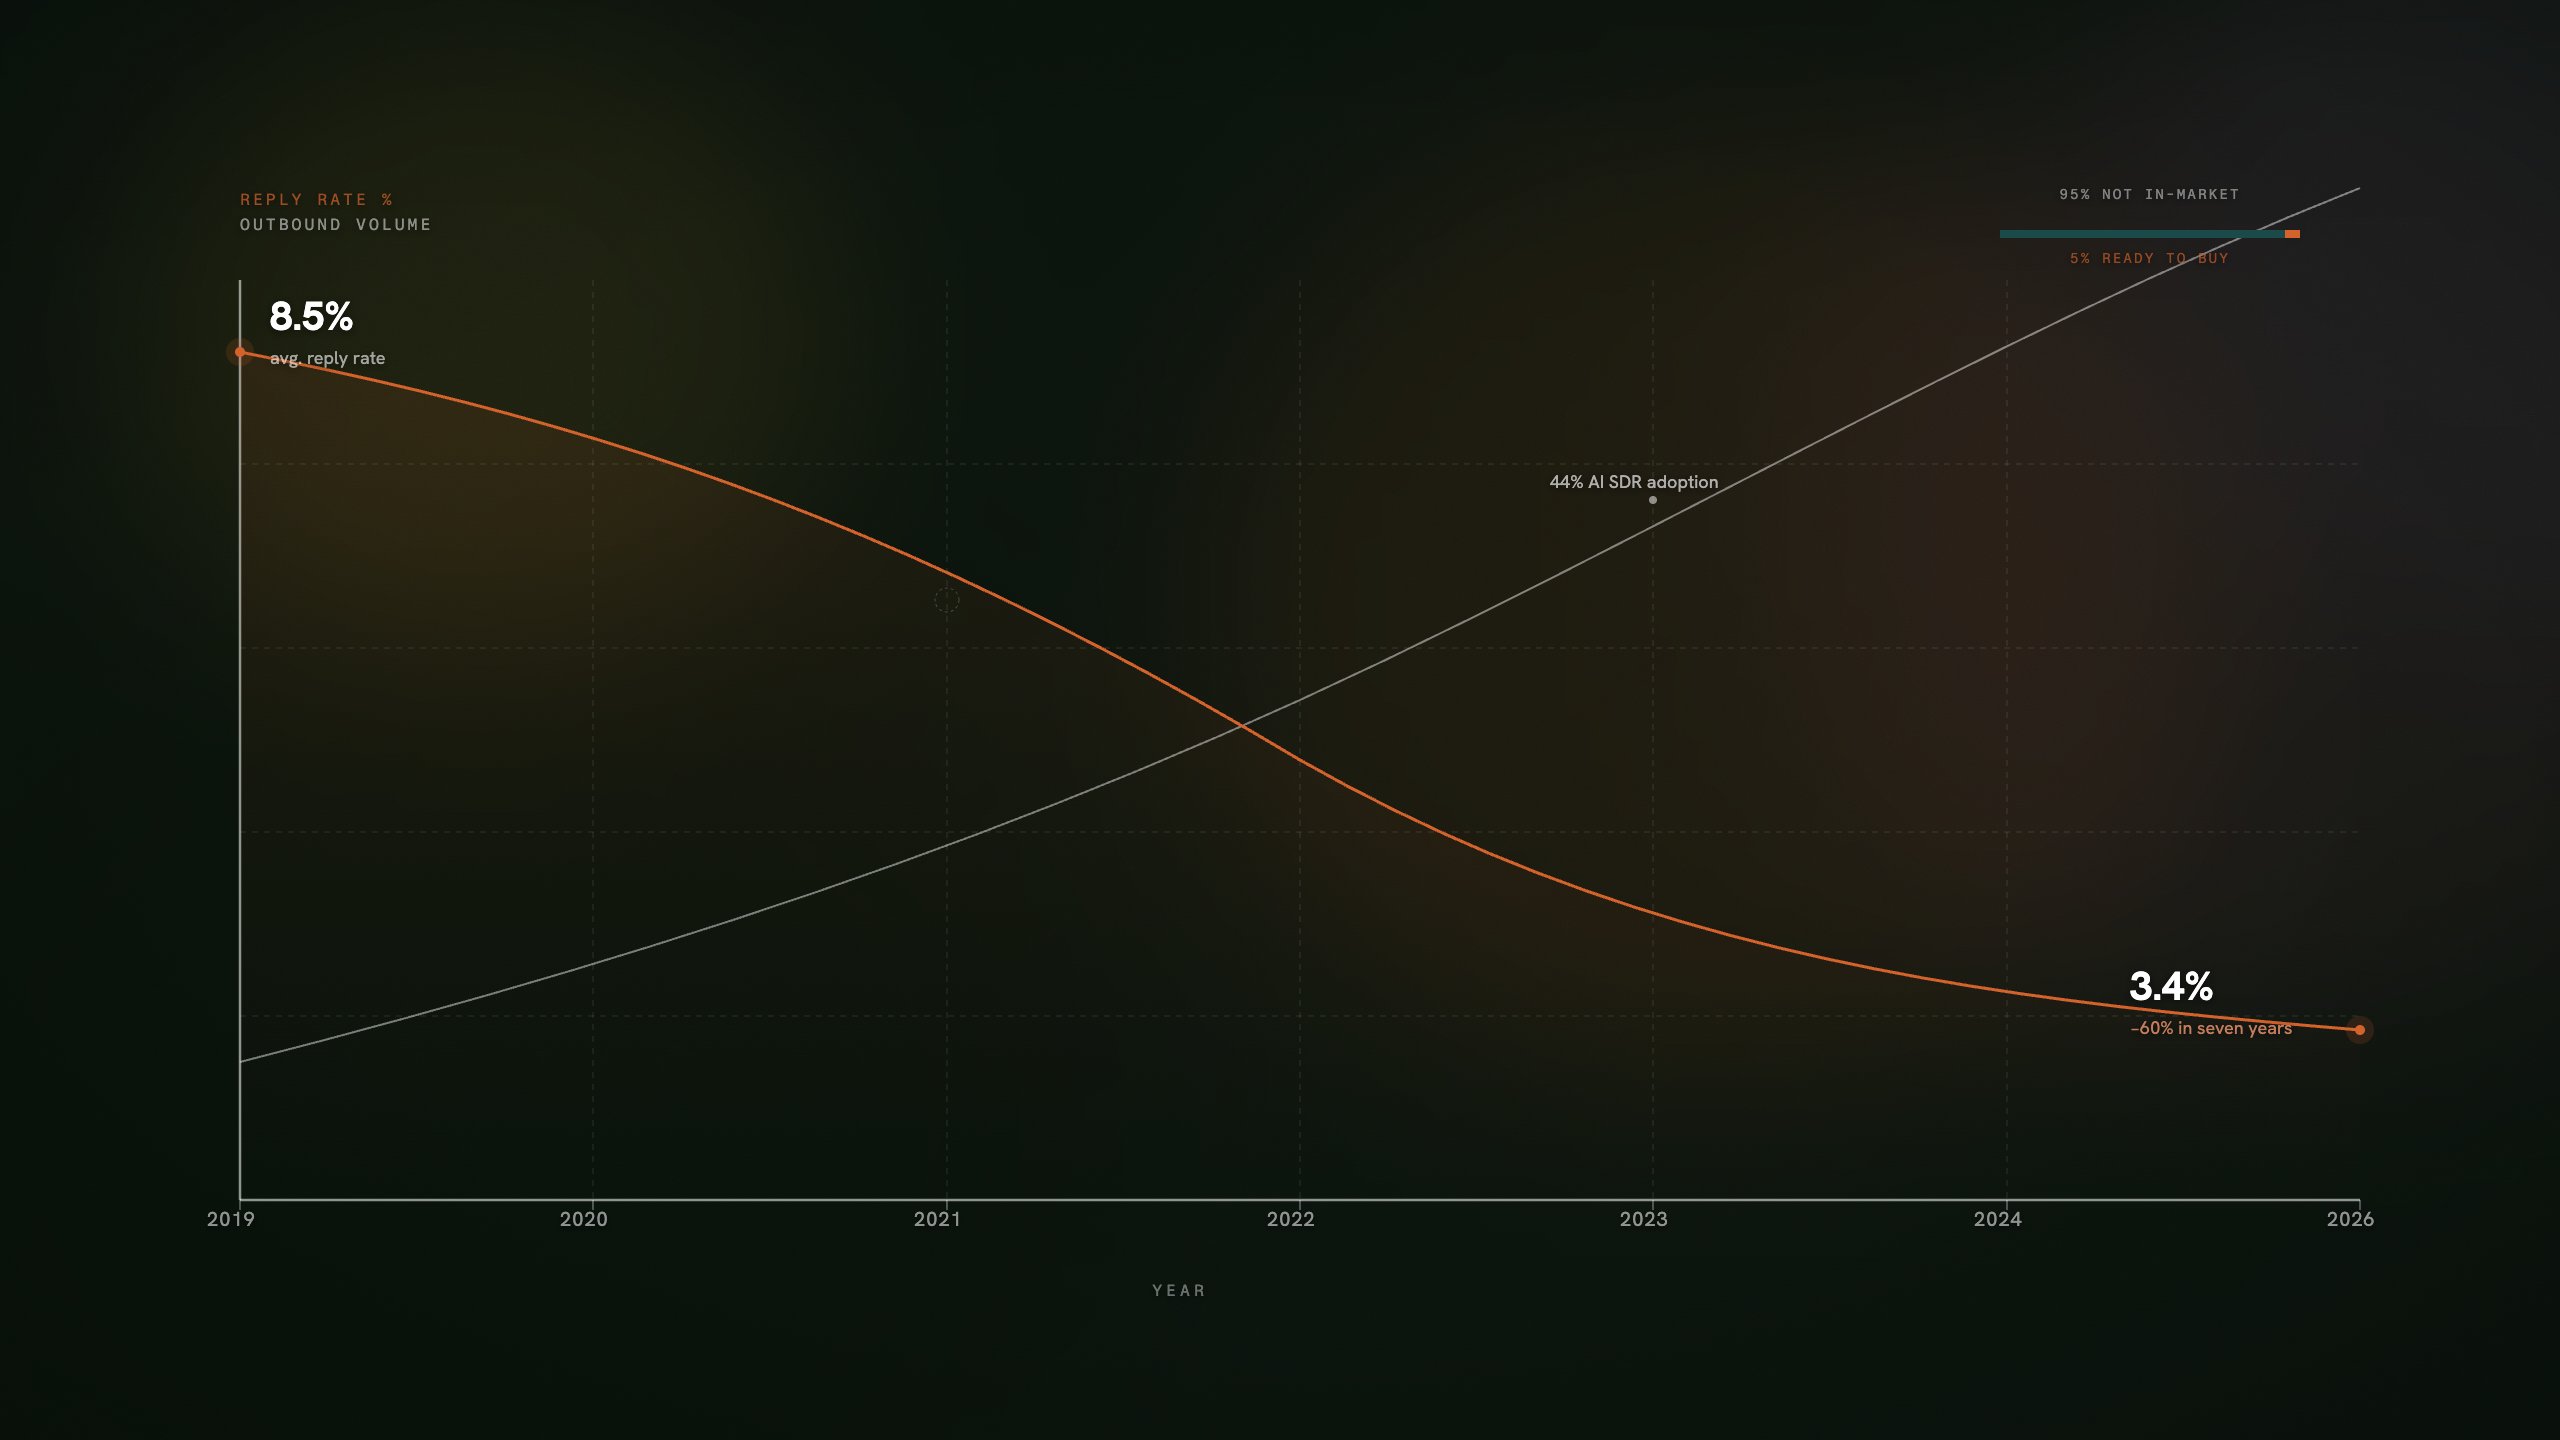
The average cold email reply rate has dropped from 8.5% in 2019 to 3.4% in 2026. That’s a 60% decline in seven years. Not because the tools got worse. But because everyone is using them. 44% of all B2B sales teams now work with AI SDRs. A single SDR can reach three times as many prospects as was manually possible. The total volume of cold outreach per inbox has exploded. Google, Yahoo, and Microsoft have responded. Since 2024-2025, they actively block non-compliant bulk email. Gmail has been bouncing non-compliant messages since November 2025 - not filtering to spam, but rejecting outright. The result: the infrastructure that volume-based outbound relied on is being systematically dismantled.
But the real problem runs deeper than deliverability.
The structural mismatch. The Ehrenberg-Bass Institute - the same researchers whose 95/5 rule we applied in our Growth Media analysis - demonstrated that at any given moment, only 5% of your Total Addressable Market is actively in-market. The remaining 95% isn’t considering, comparing, or buying. Not now. Not next week. Maybe in six months. Maybe in two years.
This isn’t marketing theory. It’s a statistical fact, validated by Professor John Dawes based on years of B2B buying behavior analysis. And here’s where it gets painful: traditional outbound targets the entire TAM as if everyone is in-market. Without signal data to identify the 5%, every email, every call, every LinkedIn message is a lottery with - at best - a 1 in 20 chance of reaching someone who cares.
AI hasn’t changed that lottery. AI has multiplied the number of tickets you can buy per hour.
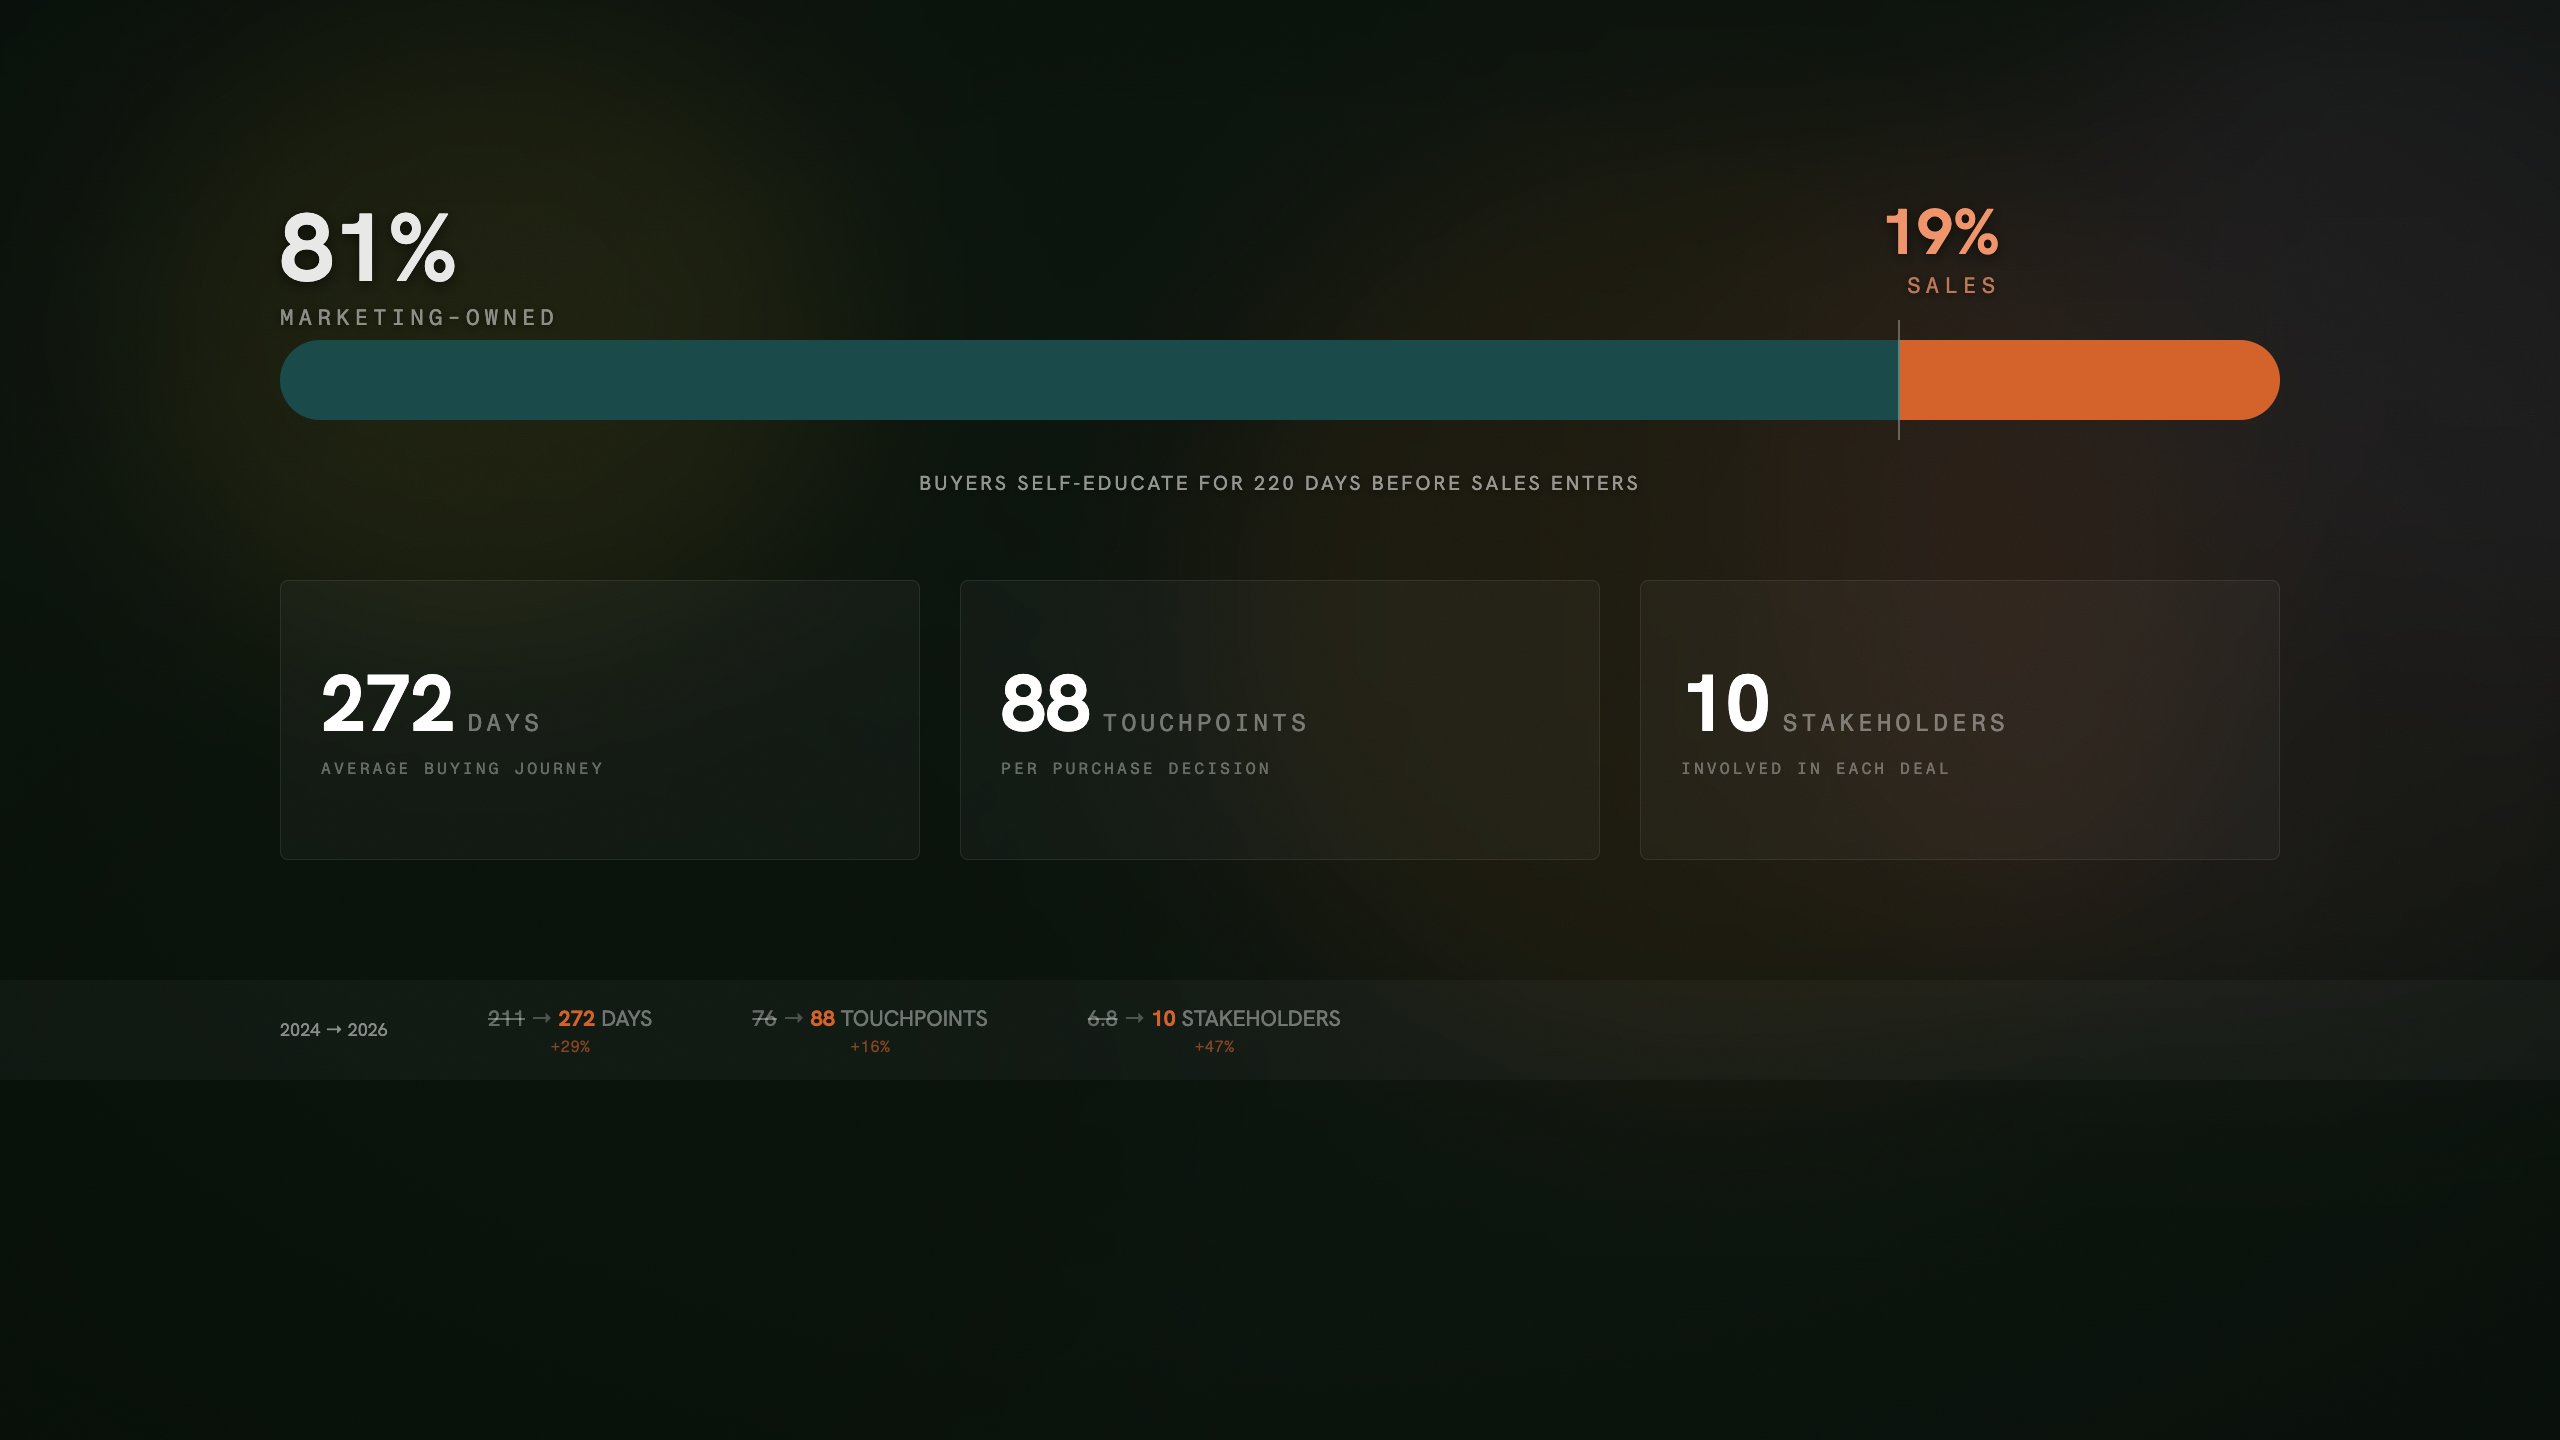
Dreamdata’s 2026 LinkedIn Ads Benchmarks Report - based on 66 million sessions across 3.5 million buying journeys - reveals the true complexity: the average B2B buying journey now takes 272 days (up from 211 in 2024). Buyers go through an average of 88 touchpoints (up from 76). 10 stakeholders are involved in a single purchase decision (up from 6.8). Buyers spend the first 220 days - over seven months - on self-education before entering the sales pipeline. 81% of the entire buying journey is now marketing-owned.
At the same time, 70-80% of the buying journey is invisible to your CRM. This is the dark funnel: conversations in Slack, DMs on LinkedIn, community groups, podcasts, AI search queries, anonymous browsing on review sites. Touchpoints you can’t measure, can’t attribute, and can’t target with volume-based outbound.
The conclusion is inescapable: if 95% of your market isn’t buying, 80% of the journey is invisible, and buyers spend 220 days self-educating before sales enters the picture - then sending more is by definition the wrong strategy.
FACT AND FICTION
Five common claims about outbound, tested against the data
Before we get to the framework, let’s clean up what’s true and what’s false in the outbound debate.
Fiction: “More outbound = more pipeline.” Volume no longer correlates with results. Reply rates have dropped 60% while volume exploded. Sending 10,000 generic emails at a 3.4% reply rate generates 340 responses - most of which are negative or uninterested. The reputational damage to your domain, the cost of bounce management, and the risk of your future emails being blocked outweigh the return.
Half truth: “AI personalizes, so it works better.” AI can personalize on name, company, role, and recent activity. But personalized irrelevance is still irrelevance. If someone isn’t in-market, it doesn’t matter how well-crafted your message is. The timing is wrong. The difference: a message saying “Hi Jan, I noticed you just had a funding round” to someone actively looking for solutions versus the exact same message to someone who won’t buy for two years.
Fact, but incomplete: “Our ICP is sharp, so we’re reaching the right people.” A sharp ICP defines who you should reach. But not when. The right person at the wrong time is - operationally - the wrong person. The 95/5 rule means that even with a perfect ICP, 95% of your list is irrelevant for outbound at any given moment. Without signal data, you don’t know which 5% is ready.
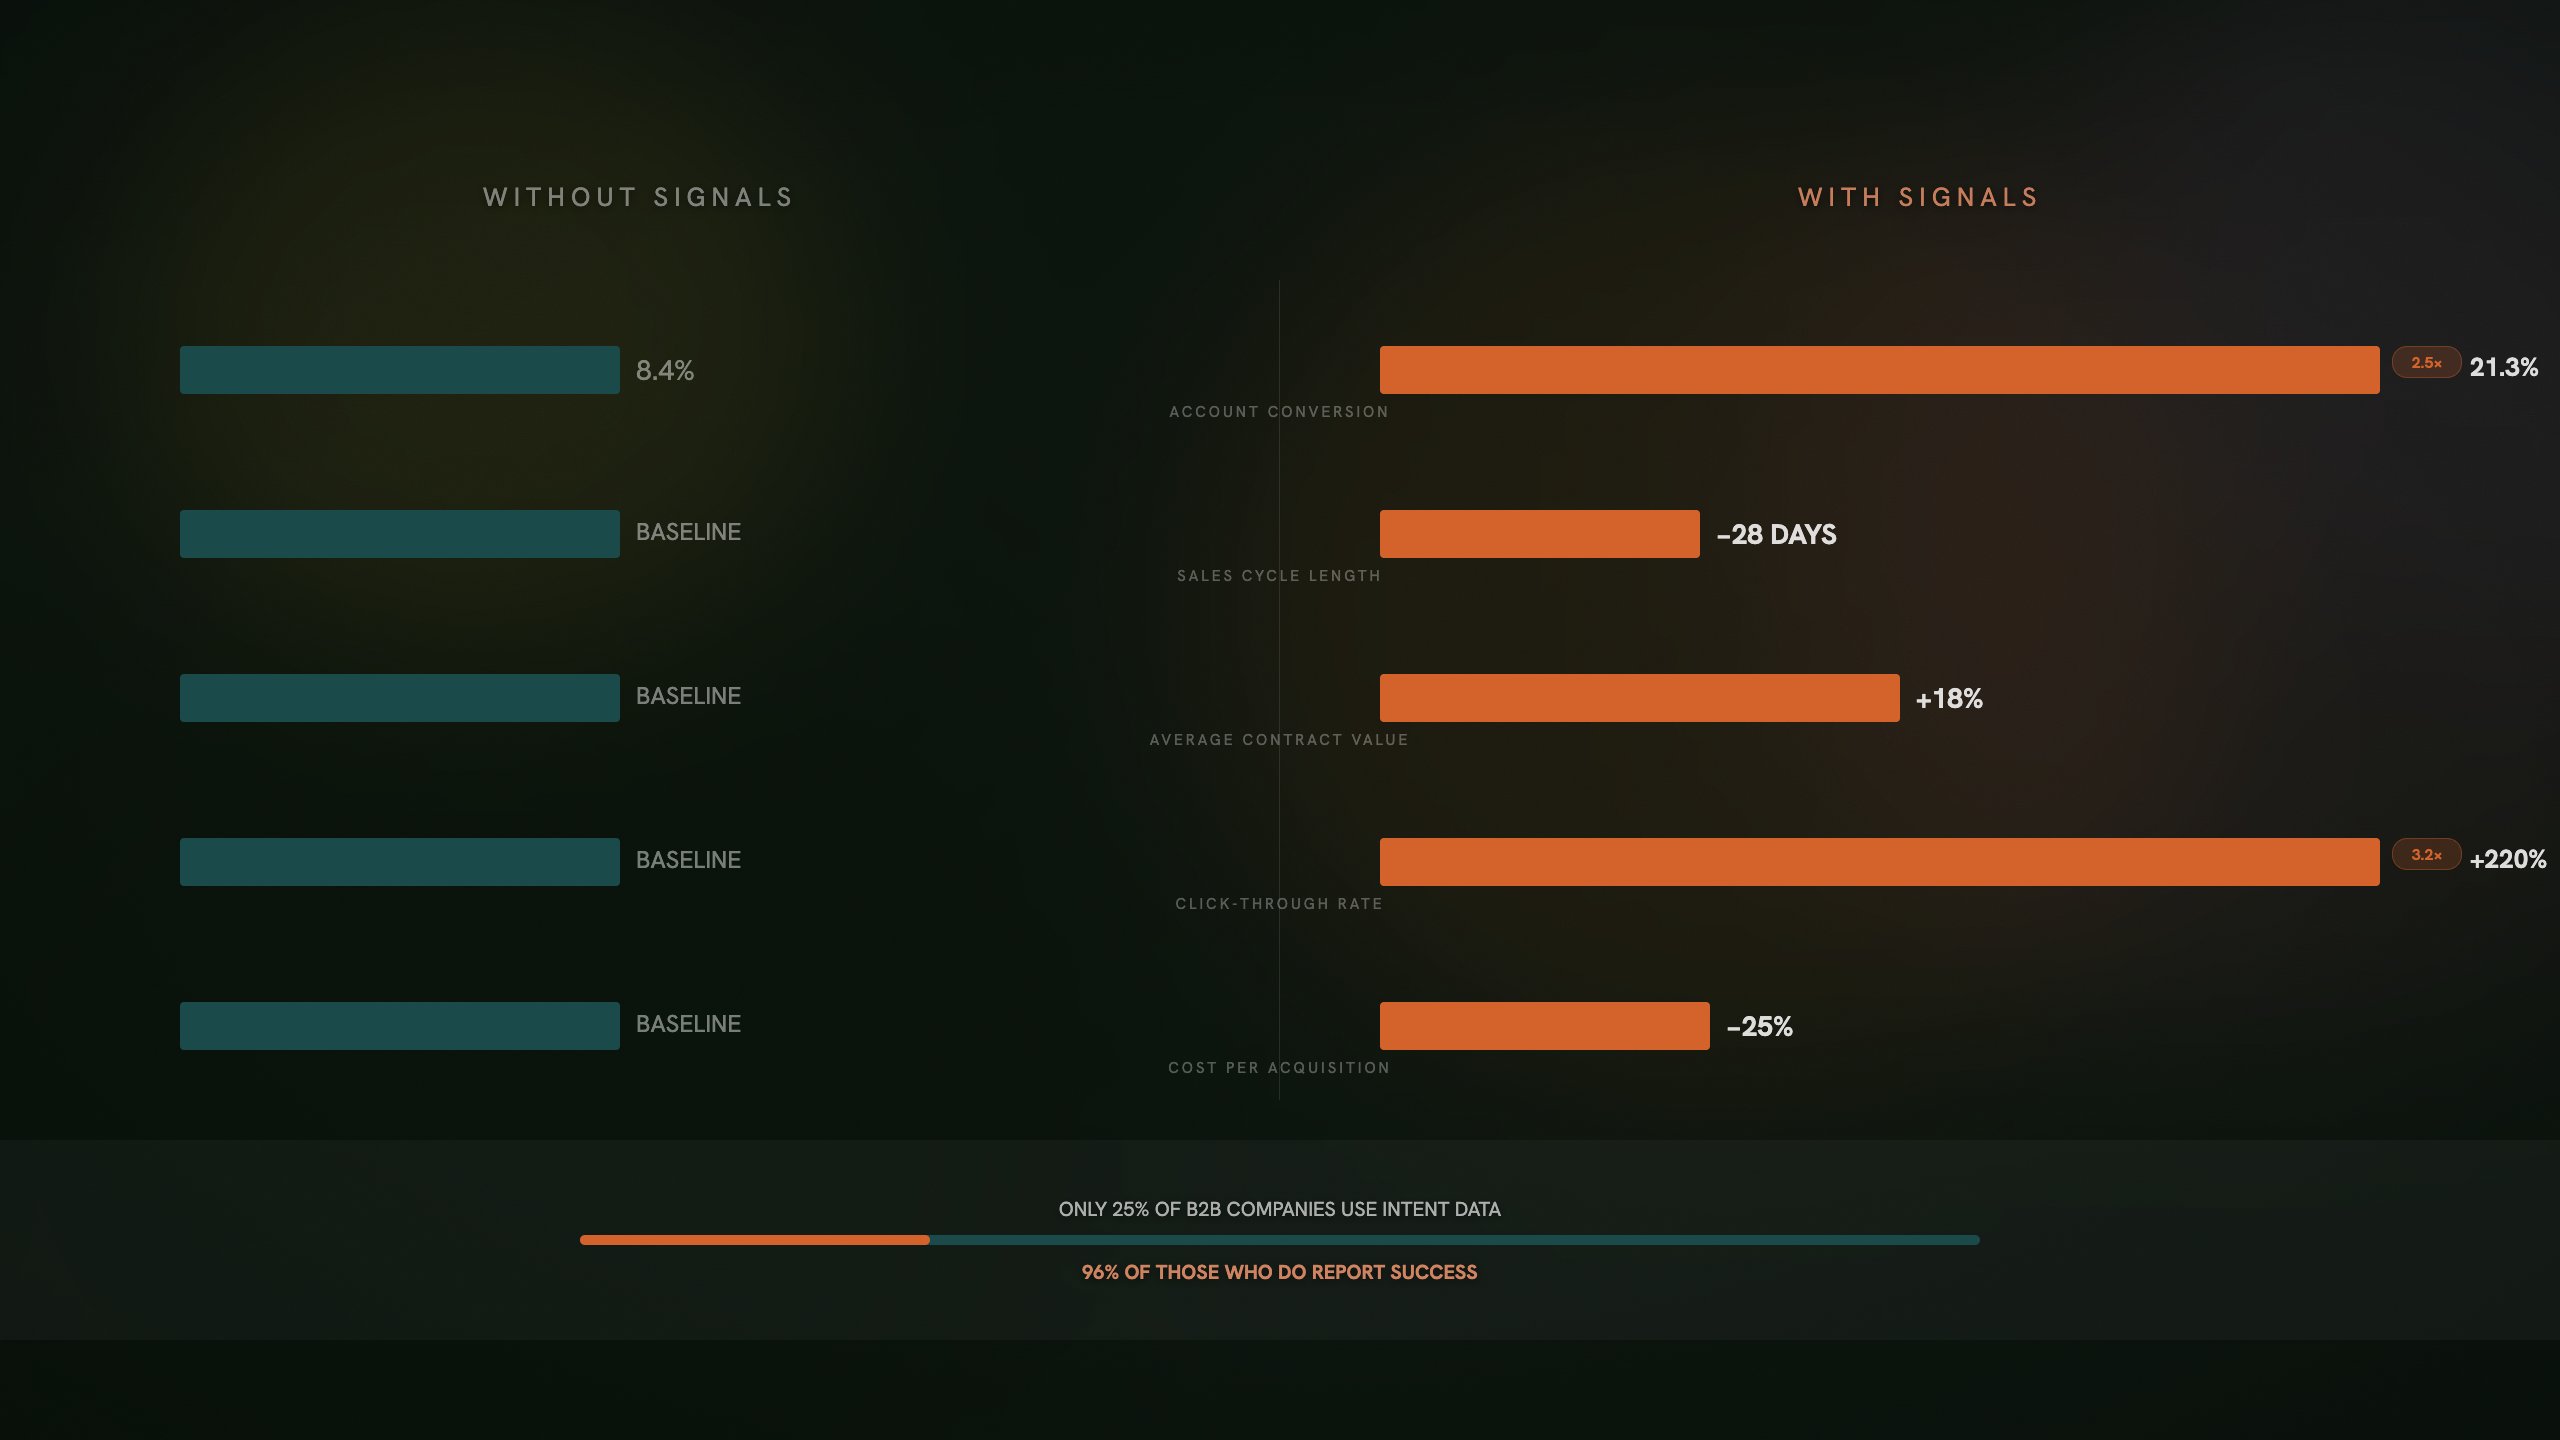
Fiction: “Outbound doesn’t work anymore.” Signal-based outbound performs spectacularly. Intent-prioritized accounts convert at 21.3% versus 8.4% for non-prioritized accounts - a factor of 2.5x. Deals from intent-sourced accounts carry 18% higher contract values. The sales cycle compresses by an average of 28 days. Outbound works. But only as a system, not as a volume dial.
Fiction: “Intent data is only for enterprise.” 92% of B2B teams successfully integrate intent data into their marketing stack. 61% realize ROI within six months. The tooling is more accessible than ever - from website visitor identification (free to start) to full-stack signal platforms. The barrier isn’t budget. The barrier is the realization that you need it.
THE DEFINITION
What is a GTM Blueprint
A GTM Blueprint is not a tool, not a channel, and not a campaign. It’s the architecture that determines how your entire go-to-market system works together - from identifying your ideal customer to the moment of conversion and everything in between.
Where traditional outbound revolves around activity (how many emails, how many calls, how many meetings), a GTM Blueprint revolves around system: which signals do you use, how do you respond to them, and how do you orchestrate the collaboration between marketing, sales, data, and technology?
Spray & pray asks: “How many people can we reach?” Signal-based GTM asks: “Who should we reach, and when?”
The transition outlines three eras:
~2005 - The cold list. Print a call sheet. Dial from top to bottom. Hit rate: roughly 1 in 200. Pure chance.
~2022 - Smarter, but manual. Lead, email, call, meeting. More efficient through tooling, but still based on lists and assumptions. Hit rate: roughly 1 in 50.
~2026 - Ecosystem of triggers. Testing multiple signals simultaneously. Data decides. Timing, context, and relevance determine when you move - not your call sheet. Hit rate: signal-driven.
The shift is fundamental: from push (you decide when to reach out) to respond (the buyer’s behavior determines when you move).
THE FRAMEWORK
Three pillars. One system.
A GTM Blueprint consists of three pillars. Within each pillar, signals play a specific role.
PILLAR 1
Foundation - ICP, Offer, Channel Strategy
Without foundation, signals are noise. The first pillar addresses the question that must be answered before everything else: who do you sell to, what do you offer, and through which channel?
ICP (Ideal Customer Profile). An ICP isn’t a list of company characteristics. It’s an operational filter that determines which signals are relevant. If your ICP is too broad, every signal platform generates hundreds of “warm” accounts per week that your sales team can’t act on. A sharp ICP - based on industry, size, technology, growth indicators, and buying readiness - reduces noise to signal.
Offer. Your outreach is only as strong as your offer. Not your product features, but the problem you solve and the urgency you create. In a signal-based system, your offer becomes contextual: you adapt your message to the signal that triggers the outreach.
Channel strategy. Not every signal leads to the same action. A website visitor viewing your pricing page requires a different channel and a different tempo than a company reviewing similar products on G2. The channel strategy defines which combination of email, LinkedIn, phone, and advertising you deploy per signal type.
The signal types. Signals are the fuel of the system. They fall into three categories:
First-party signals - data you generate yourself. Website visits (which companies are viewing your pricing page?), content engagement (who downloads your whitepapers, opens your emails?), product usage data (for SaaS: who’s using which features intensively?), event registrations and webinar attendance.
Third-party signals - data from external platforms. Intent data (which companies are actively searching for your category on review sites, in content hubs?), G2/Capterra/TrustRadius comparison activity, LinkedIn engagement with competitors, technographic changes (companies implementing or removing tools in your category).
Trigger events - changes that predict buying readiness. Funding rounds (new capital = new budget), leadership changes (new CMO/CRO = new strategy), hiring patterns (who’s recruiting in your domain is investing in it), company relocations, mergers, product launches.
PILLAR 2
Execution - Orchestration, Content, Inbound Activation
The second pillar translates signals into action. The difference between a system and a tool is orchestration: who does what, when, based on which signal?
The 48-hour window. Research consistently shows that the speed at which you respond to a signal determines the outcome. Those who respond within 48 hours of a buying signal see 4x higher conversion than those who move later. After 48 hours, the buyer’s attention shifts to the next priority. The first vendor to engage during active evaluation wins disproportionately.
This means signal processing cannot be manual. The time between signal detection, enrichment, scoring, and outreach must be automated - not “sometime this week,” but within hours.
Multi-channel orchestration. A signal doesn’t lead to a single email. It triggers an orchestrated sequence across multiple channels. Email - context-rich, short message that references the signal (not: “I saw you visited our site,” but: providing value on the topic they’re researching). LinkedIn - connection request or DM that adds value, no pitch. Advertising - retargeting specifically on the signaled company (account-based advertising). Phone - only after digital signals confirm warmth.
The sequence, timing, and cadence are determined by signal strength and type. A HOT signal (pricing page + multiple visits + ICP match) gets immediate follow-up. A WARM signal (blog visit + download) enters a nurture sequence.
Inbound activation. The most powerful form of signal-based GTM is inbound-led outbound. The structure: Lead magnet - benchmark report, tool, or analysis that delivers value in your niche. Nurturing - 3-5 emails that deliver value, no pitch. Signal - opens, clicks, site visits detect warmth. Warm conversation - not cold calling, but following up with context.
Content in this model isn’t marketing output. It’s a signal generator.
PILLAR 3
Intelligence - Enrichment, Scoring, Automation
The third pillar makes the system intelligent. Without data enrichment, signals are incomplete. Without scoring, they’re not prioritized. Without automation, they’re too slow.
Enrichment. A website visit is an IP address. Enrichment turns it into a company, with industry, size, location, tech stack, and recent hiring activity. Tools like Clay, Clearbit, and Apollo make enrichment programmable - a visitor becomes a complete profile with the right contact person in seconds.
Scoring. Not every signal is equal. A signal-scoring model weighs: Signal strength - pricing page > blog > homepage. Frequency - three visits in a week > one visit in a month. ICP fit - does the company match your ideal customer profile? Timing - how recent is the signal? Multi-source - signals from multiple sources simultaneously (first-party + third-party) carry more weight.
The output is a prioritized list: HOT, WARM, COLD. Sales spends time on HOT. Marketing nurtures WARM. COLD is not contacted - but observed.
Automation. This is where AI comes into its own - not as a mailer, but as a system component. AI that detects and classifies signals, enriches data and matches contact persons, triggers sequences based on scoring, personalizes content based on signal context, and recognizes patterns that human analysts miss.
The difference from “AI outbound”: AI isn’t deployed to send more, but to make the system more intelligent. The output isn’t volume, but precision.
THE PATTERN
Six Growth Motions, Signal- based
Just like with Growth Media (see one of our other articles), signal-based GTM manifests differently per growth motion. The 95/5 rule applies universally, but the signals and responses differ.
Founder-led - systematize your network. In founder-led sales, the signals already exist - they’re in the founder’s head. The founder knows who was at the event, who responded on LinkedIn, who calls when there’s budget. But that doesn’t scale. The GTM Blueprint replaces intuition with system: document which signals the founder unconsciously uses, and automate their detection.
Sales-led - from call list to signal list. The most direct impact. SDRs working from signals instead of static lists approach prospects who are actively searching - not prospects who happen to fall into a segment. The result: meetings from signal-based outreach close at significantly higher rates than cold-sourced meetings. SDRs are freed up by automation of enrichment and prioritization - so they spend time on conversations, not research.
Marketing-led - content as signal generator. Content marketing shifts from “publish thought leadership and hope for leads” to a deliberate signal ecosystem. Every content asset is designed to generate a specific buying signal. A comparison guide generates a different signal than an ROI calculator. Content strategy is backward-designed from the signals you want to detect.
Marketing-led sales - the alignment engine. The biggest frustration in marketing-led sales is the disconnect: marketing delivers MQLs, sales doesn’t find them good enough. Signal-based GTM solves this through objective, behavior-based qualification. No debate about “is this lead warm enough?” - the signal-scoring model provides the answer. 53% of B2B marketers use intent data specifically for sales-marketing alignment. The result in organizations with strong alignment: 36% higher customer retention and 38% higher sales win rates.
Product-led - usage data as buying signal. For SaaS companies with a freemium or trial model, product usage data is the most powerful first-party signal in existence. Which users are hitting the limits of the free plan? Who’s activating premium features? Who’s adding team members? Product-qualified leads (PQLs) are signal-driven by definition - the challenge is integrating them into the broader GTM system.
Partner-led - referral as signal. Partner referrals are the highest-conversion signals that exist: someone the buyer trusts says “look at this.” The GTM Blueprint builds a systematic referral tracking system with automated follow-up, instead of depending on ad-hoc introductions.
EVIDENCE FROM PRACTICE
What the data shows
The data isn’t anecdotal. These are benchmarks based on millions of data points.
Dreamdata 2026 Benchmarks. Dreamdata’s research, based on aggregated data from thousands of B2B companies, shows the shift: average buying journey went from 211 days (2024) to 272 days (2026), a 29% increase. Touchpoints rose from 76 to 88 (+16%). Stakeholders involved grew from 6.8 to 10 (+47%). 81% of the journey is now marketing-owned. Buyers self-educate for 220 days before sales enters.
Intent data performance. From multiple sources (Landbase, Zymplify, Span Global Services, Dreamdata): account conversion jumps from 8.4% to 21.3% (2.5x). Sales cycle shortens by 28 days. Contract value increases by 18%. Click-through rate lifts by 220%. MQL-to-SQL conversion improves by 34%. Qualified pipeline grows by 30-50%. Cost per acquisition drops by 25%.
G2 intent signals. Specifically for companies integrating G2 intent data: deals with a G2 intent signal are 2x larger in value than average. 12% of closed-won deals show direct G2 intent influence in multi-touch attribution.
The 48-hour effect. The impact of speed on signal response: responding within 5 minutes gives a 21x higher chance of conversion versus waiting 30 minutes. Responding within 48 hours delivers 4x higher conversion than later. After 48-72 hours: the window closes. The buyer has moved on.
Adoption vs. results - the gap. The most striking data point: 96% of B2B companies using intent data report success. But only 25% of B2B companies use it at all. That gap isn’t a quality problem - it’s an awareness problem. And it creates a window of competitive advantage for early adopters.
WHAT TO DO NEXT?
Five actions to start tomorrow
Not a full roadmap, but five actions that make the difference for most B2B organisations starting now.
1. Map your signals. Before buying new tools: inventory which signals you already generate but don’t use. Website traffic (which companies visit your site?), email engagement (who opens and clicks?), content downloads, event registrations, product usage. Most B2B companies are sitting on a mountain of unused first-party data. Start tomorrow: install a website visitor identification tool. Many offer a free tier. Within 24 hours, you’ll know which companies are visiting your site - that’s your first signal layer.
2. Sharpen your ICP into an operational filter. An ICP on a slide isn’t an ICP. An operational ICP is a set of criteria you can program into your tooling: industry, size, technology, growth indicators, geography. Test your ICP by analyzing your last 20 won deals: what characteristics do they share? That’s your real ICP - not what you think it is, but what the data shows. Start tomorrow: export your 20 best deals, identify the 5 common characteristics, and translate them into filterable criteria.
3. Build a signal-scoring model. Not every signal is equal. A pricing page visit from an ICP-fit company is HOT. A blog visit from a company that’s too small is COLD. Define three levels (HOT / WARM / COLD) based on signal strength × ICP fit × recency. Start simple - you can refine later. Start tomorrow: create a spreadsheet with two axes: signal type (pricing, blog, download, intent) × ICP fit (yes/no). Assign each cell a score. That’s your v1.
4. Design 48-hour response workflows. The difference between “we use signals” and “we have a system” is the response workflow. When a HOT signal comes in: what happens? Who gets notified? Which sequence is triggered? Through which channel? Design the workflow for your top 3 signal scenarios and automate them. Start tomorrow: choose your #1 signal (often: pricing page visit by an ICP-fit company). Define the response: enrich the company, find the right contact, send a context-rich email, add on LinkedIn, schedule a call.
5. Shift budget from volume to system. The ROI case is clear: intent-based campaigns deliver 2.5x better conversion at 25% lower acquisition costs. Every euro you move from generic bulk outreach to signal-based GTM yields more. Start by reallocating 20% of your outbound budget to signal infrastructure and measurable workflows. Scale based on results. Start tomorrow: calculate your current cost-per-meeting from cold outbound. That’s your benchmark. Anything that outperforms it deserves more budget.
THE PRINCIPLE
Outound isn't dead. Spray & Pray is dead
The 95/5 rule doesn’t change with better tools. AI doesn’t make you faster at reaching the 5% - unless you first know who they are. A GTM Blueprint replaces volume with intelligence: not sending more, but knowing better when and to whom.
The companies that will grow disproportionately in the coming years aren’t the ones with the most SDRs or the best AI writing software. They’re the companies that build a system that detects, enriches, scores, and orchestrates signals - and translates that into action within 48 hours.
Outbound isn’t dead. Spray & pray is dead.
FREQUENTLY ASKED QUESTIONS ABOUT THE GTM BLUEPRINT
What's the difference between intent data and lead scoring?
Lead scoring evaluates known leads based on demographic and behavioral characteristics (job title, company size, page visits). Intent data identifies unknown accounts that are actively researching your category - before they fill out a form. Lead scoring says: “this lead is warm.” Intent data says: “this company is searching - and you don’t know them yet.”
How quickly can I expect results?
61% of B2B teams realize ROI within six months of implementing intent data. First improvements - higher reply rates, better lead quality - are often visible within 60-90 days. The fastest win: activate website visitor identification and start following up.
Does this work for smaller B2B companies too?
Yes. 92% of B2B teams successfully integrate intent data, regardless of company size. Website visitor identification is free to start. Clay offers affordable enrichment. The investment scales with your team. Start with first-party signals - they cost nothing extra.
Should this replace our current outbound?
No - it improves it. Your existing sequences, templates, and channels remain. The difference is when you deploy them: not on a random Monday for everyone on your list, but when a signal indicates that a specific account is in-market. Same activity, better timing.
How does this relate to ABM (Account-Based Marketing)?
ABM and signal-based GTM are complementary. ABM defines which accounts you target (the “who”). Signal-based GTM adds the “when”: which of your target accounts are currently active? The combination - ABM + intent signals - is the strongest: you focus on the right accounts and you move when they move.
What tools do we need?
Start minimal: a website visitor identification tool (Leadfeeder, Clearbit Reveal, or similar), an enrichment tool (Clay, Lemlist, Apollo), and your existing email/CRM platform (HubSpot is excelent). That’s enough for a v1. Scale to intent data providers (Bombora, G2, ZoomInfo) and orchestration platforms once the foundation is in place.
How do I measure if it's working?
Compare the conversion and sales cycle of signal-triggered outreach versus your existing cold outbound. The key metrics: reply rate, meeting-booked rate, opportunity conversion rate, sales cycle length, and cost-per-opportunity. Measure per signal type to discover which signals predict best.
Sources: Ehrenberg-Bass Institute / Professor John Dawes (95:5 Rule) · Dreamdata LinkedIn Ads Benchmarks Report 2026 · Dreamdata 2025 Report · Instantly (cold email benchmarks 2019-2026) · Belkins (16.5M cold emails analysis) · LinkedOtter (AI SDR adoption 2026) · Landbase (intent signal statistics 2026) · Span Global Services (intent data adoption) · Zymplify (buyer intent data statistics) · Mixology Digital (intent data integration) · Dreamdata (G2 intent data impact) · Gartner (2024, 2026) · Forrester (2024) · Similarweb / HockeyStack (dark funnel research) · Rodz.io (intent-signal benchmarks) · Launch Leads (48-hour window data) · Salesmotion (speed-to-engage research).
This article was written by the Gradient GTM Strategy Team. Gradient helps B2B companies break through growth ceilings by building scalable GTM systems. Want to build your own GTM Blueprint together? Join us at our GTM Blueprint event on October 8, 2026 in B. Amsterdam.





Ready to design a more connected growth system?
Book a Call

Free Growth Scan

